I created a digitized dataset of Cleveland’s historical land annexations and it didn’t exist before. Thanks to this data set, I was able to make this time-lapse map displaying the growth of Cleveland’s historic annexations and additional research can more easily be done.
More below on what I learned, why I did it, what else can be done with this new data set.
If you just want the data set, download the annexation boundaries at https://github.com/skorasaurus/cleboundaries
Why I did this:
As a part of my day job as a web developer at the local library, I met with Marty, the City of Cleveland Archivist, about an unrelated issue with the Cleveland Public Library website. He graciously gave me a tour of the City Archives across from the Justice Center in Downtown Cleveland. He had large copy (2 x 3 foot) of an annexation map from 1968 on the wall and often referenced it for city employees. I’ve been a fan of maps and he mentioned in passing that since that map’s publishing, there have been additional annexations but no map has been made since then*** and no one had the time or resources to do it.
(Just in early 2019, I found an annexation map on made in wikipedia made around 2010 by Paul J Meissner but I haven’t been able to contact him or obtain it in a higher resolution. Additionally, that map appears to use Google which goes against Google’s Terms and Conditions and is not on very firm ground to be legally shared.
Aloud to Marty, “I could make you a newer print map with those annexations”, I offered to make one (I’m still working on it).
To make a new print map, you would need the annexation boundaries data set first.
That data set didn’t exist, until now.
Answering historical questions that couldn't be answered before:
Creating this data set by creating the digital boundaries doesn’t solve any civic technology problems by itself; but like other open data sets, it can, with additional effort, be used in with other data sets to answer questions like:
- How much of Cleveland's population growth in the 19th and 20th century can be attributed by annexating other places?
- Did Cleveland's population grow at the same proportion in the 20th century as its size?
- Did proposed or implemented annexations had any influence on development patterns or migration patterns for residents in the 19th and 20th century?
I’m also casually interested in how past city decisions influence our present day. How would Cleveland and Northeast Ohio would be different if certain areas were never annexed or annexed at a later date (or certain places that were once considered for annexation, like East Cleveland and Lakewood, were annexed).
In the process of creating these boundaries, a scholar had contacted the Cleveland Public Library with a research question seeking the historical Cleveland boundaries (!) (I found out through my day job) and I was able to provide him with some of my data.
These boundaries can also be used as the basis for a new printed map of Cleveland annexations.
A look at historic open data
Through my years in open data advocacy and mapmaking, I hadn’t known much about available past, open accessible historic geospatial data. Historic geo data generally wasn’t included in municipal open data portals.
Before this project, I hadn’t known of any historical annexation boundaries to exist but Karl Phillips has been doing prolific work on digitizing historic annexation boundaries and had been putting his annexation boundaries up on mapstory (a neat site in its own right) although you won’t find them there right now; mapstory redesigned their site and deleted some of the existing work. Karl told me he’s planning on reuploading them to mapstory. Reach out to him at Phillips AT MapStory dot org.
In addition, this project may be used to get myself and others more attention to the question of who should store historic geospatial data (and how).
I suggest that the overlooked the public library may be appropropriate:
I discuss in an earlier post why public libraries can be great places to host and curate civic data (domain expertise of subjects, community understanding/trust as a place to get knowledge in a way that doesn’t feel as stuffy or intimidating as an academic library would, and a 3rd party source [generally] outside of direct municipal government control).
Although Mapstory likely had good reasoning why they deleted previously uploaded data sets and had good intentions in the first place, it’s an example of caution to rely on 3rd party sources for historic information. In case where others like entities like mapstory may temporarily data that was behind the map (although I’m sure they had good intentions and reasoning why they had to delete the data sets). (I did contact them about 2 weeks ago asking to learn more but did not receive a response.)
I’ve talked with some co-workers on how that our data set can be something that we can be the steward at the library; we haven’t stored any geospatial data just yet, and to my knowledge, no or very few public libraries do yet (Maybe I’m running in the wrong circles; I’d like to know where).
That means we have to set up the resources to host it and and our current digital system doesn’t store geographic data and I’d also have to figure out how other binary data sources should be stored. This is not an insignificant question. Something I’m looking forward to figuring out and hear you opinions.
Many public libraries may not have the infrastructure or technical knowledge to do this; so maybe this is something that occurs in collaboration across multiple libraries, ala DPLA.
The geographic data set is currently available as Shapefiles and geojson at my github repository of Cleveland Boundaries, cleboundaries where the metadata and additional notes are also located to understand the data.
The data set as of this writing is not yet complete. There are several annexations from the 2nd half of the 20th century that need to be added, especially around the Cleveland International Airport.
I’d like to have a consistent way of determining annexations’ “start dates”. Should it be when the annexation was passed in legislation or when it was effective ‘on the street’? When acknowledged/recorded by the state or county? As I far as I know, all of these dates vary.
How did I do this?
The process of georectification isn’t easy, so I think there’s some value in writing this out. I’ll breifly outline how I created these polygons.
Maps that are images (not ‘web maps’ like google maps) or paper maps scanned into a computer cannot be overlaid a web map with georectification.
When you first scan a paper map into a computer, there’s no information within the image that tells the computer “this portion of the image” is in Cleveland, Ohio (or any another particular place).
Very broadly, this absence of context is similar to when you scan a paper document, you cannot immediately select the text on it. You can visually see with your eyes what the words say; but computer software only knows that there are black and white shapes there; computer software does not known those shapes also represent characters of a language.
(These are completely different processes but very abstractly, the same process. )
Transforming the image of a map (in this case, the annexation map from 1968) and aligning to specific locations by a coordinate system is known as georectification (this a term very often interchanged with ‘georeferencing’; the terms are confusing (ESRI’s definition of georectification)
Lincoln Mullen does a great job of explaining the overall process of georectification.
When I first started the project, I planned to create the geographic shapes by first georectiying what I dubbed the 1968 map, a hand-drawn map by the City Engineering and Construction Dept. that is the most recently published version of a map with the boundaries. Then, I would create the shapes by tracing over the georectified map.
I first tried georeferencing the 1968 map on mapwarper.net; a great free, open-source tool (although he deserves some $ for this, but I digress); and used OpenStreetMap as the reference map.
After making over 20 reference points with the 1968 map in mapwarper.net, I found that many places in the 1968 georeferenced map it still didn’t match up well with my reference map; In many places, I was getting only about 30-40 meter accuracy.
As shown in the image below, the black lines representing streets from the 1968 map; with aerial imagery from state of Ohio imagery (circa 2015) as the referenced map.
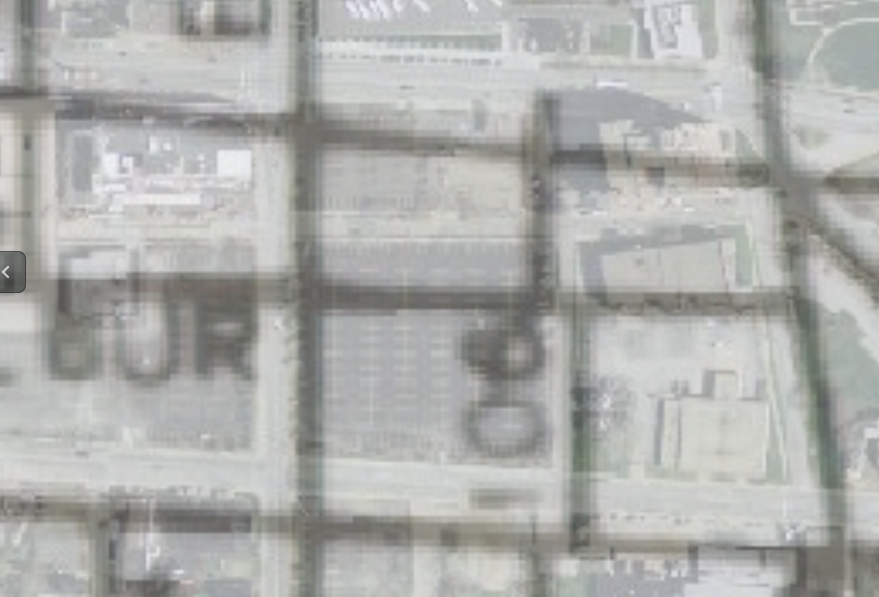
I came to the conclusion that the 1968 map wasn’t drawn very consistently. It was hand-drawn somewhat poorly and that I could not merely trace over the georeferenced 1968 map. I couldn’t rely primarily rely on that. At this point, I also began relying primarily on TIGER and the state of Ohio’s aerial imagery, to eliminate any copyright restrictions (which would have occurred if I would continue using OpenStreetMap) on my data set.
Instead, I had to use the 1968 map and the Volkmann map as sort of a guide: Look at a particular polygon in the 1968 map and volkmann map by identifying them on one of the maps(thinking my mind, “oh, western border of this polygon is a house-worth’s east of east 156th”, then open up the TIGER/State of Ohio imagery and draw it in the same location.
So, on and off, over a few months on idle Saturdays, I drew the polygons. At one point, I stopped because I wasn’t sure which dates to use in the source data as ‘actual date of when annexations were implemented’ and that discouraged me for a few months.
Not until a few months in the process, I realized that I could also use the historic plat maps from Sanborn and Hopkins some which are digitally available (but not georeferenced) from the Cleveland Public Library’s Digital Map Collection and The Library of Congress.
The Sanborn and Hopkins maps represent property-level maps of historic Cleveland from the early 20th century and late 19th century. They also include the municipal boundaries on the map.
Below is an image 4, from vol 4 of the 1896 Sanborn, courtesy of the Library of Congress
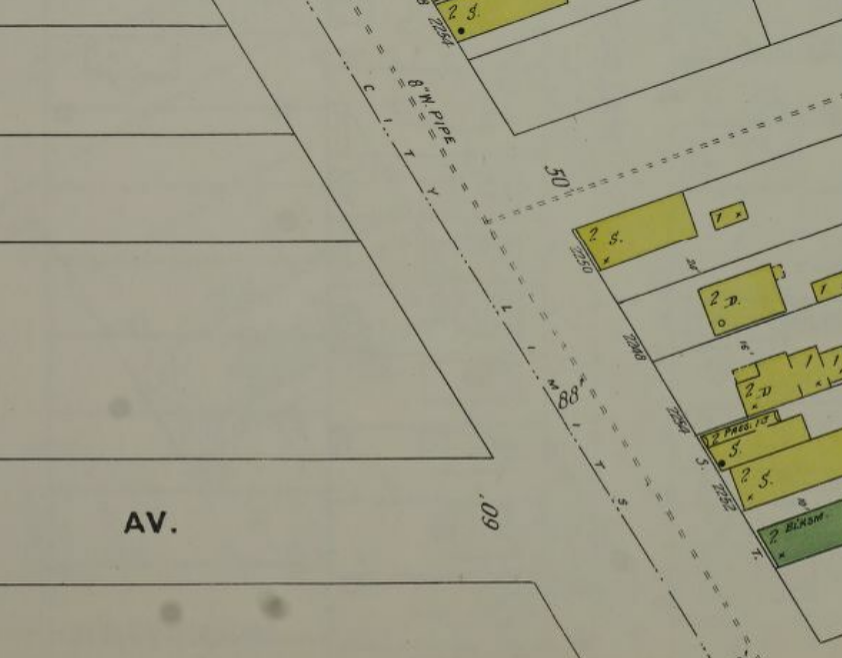
The Hopkins and Saborns provided a tremendous amount of detail that was not available in the 1968 or Volkmann maps and I began using them as my primary references.
Going forward as I refine the maps the great detail of the Sanborn and Hopkins maps along with manual verification of the original City Council legislation (the actual true authority) will likely be the best to determine the accuracy and details of the boundaries.